A quick tour of the interface
The TrainPanel main window is split into four zones.
1. The toolbar (top)

From left to right, you’ll find:
- Interaction mode:
Edit/Manual/Auto. Click to switch. - Execution mode:
Sim/Mixed/Real. Defines where commands go (simulator, command station, or both). - Microphone button (voice commands).
- Emergency stop button (red).
- File actions: new, open, save.
- View settings: 2D ↔ 3D, labels, light/dark theme, fit to screen.
- Project settings (scale, units, name).
See Concepts → Interaction modes and Execution modes.
2. The sidebar (left)
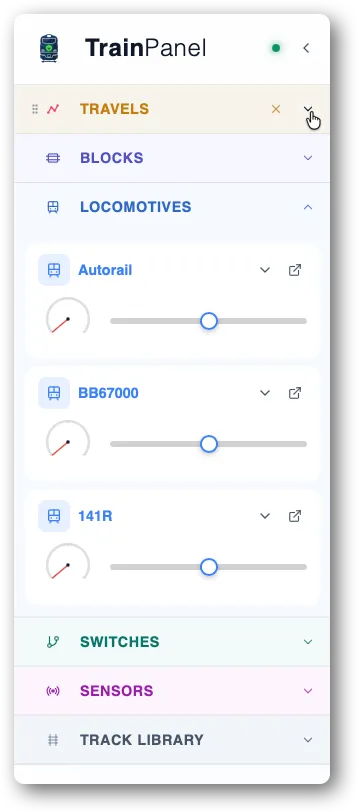
Lists your entities, grouped into collapsible sections:
- Locomotives — your rolling stock.
- Blocks — identified track sections.
- Turnouts — turnouts and other controllable devices.
- Sensors — feedback detection.
- Track library — the catalog you drag onto the canvas.
- Travel requests — the supervisor’s queue.
Click an entity to open its properties panel on the right. The sidebar can be collapsed to save space (Ctrl/Cmd + B).
Use drag-and-drop to rearrange the sections order as you wish.
3. The central area (the canvas)
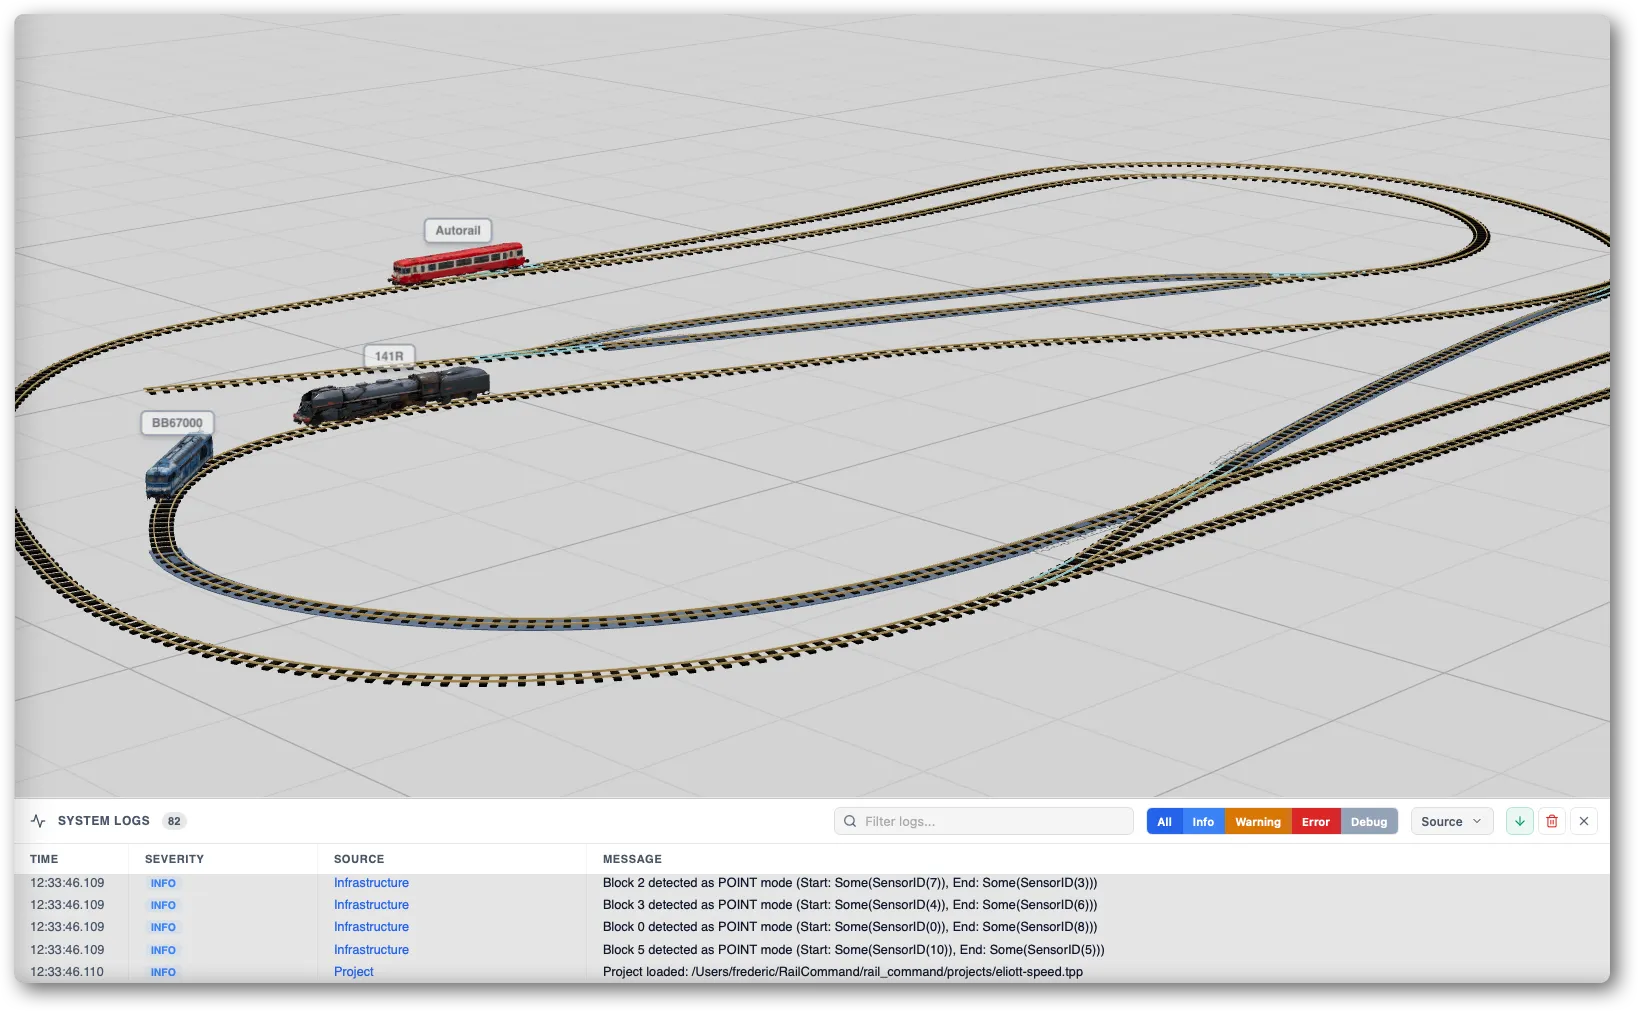
This is the layout view, in 2D or 3D depending on the toolbar toggle. You drop rails here (in Edit mode), click on turnouts and locomotives (in Manual mode), and see active travels here (in Auto mode).
See 2D vs 3D view.
4. The status bar (bottom)

Shows in real time:
- The current modes (interaction + execution).
- The DCC command station connection state (Online / Offline).
- Project statistics: number of rails, blocks, locomotives.
- The most recent log messages.
Properties panel
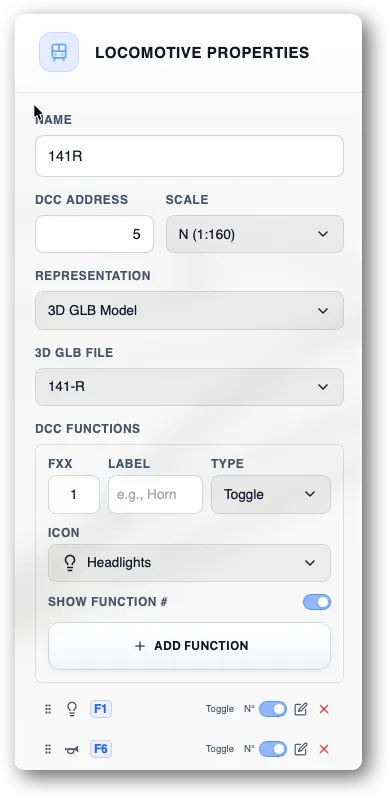
When you select a rail, block, locomotive, sensor or switch, by clicking in the central area or in the sidebar, its properties show in a dedicated panel on the right. In Edit mode, all edits there are confirmed with a Save button — until you click, your changes are not applied.